The sim racing community had little public data about its hardware, budgets, and changing habits.
I designed four surveys, cleaned and standardized the responses, and published the analysis with raw sheets and caveats.
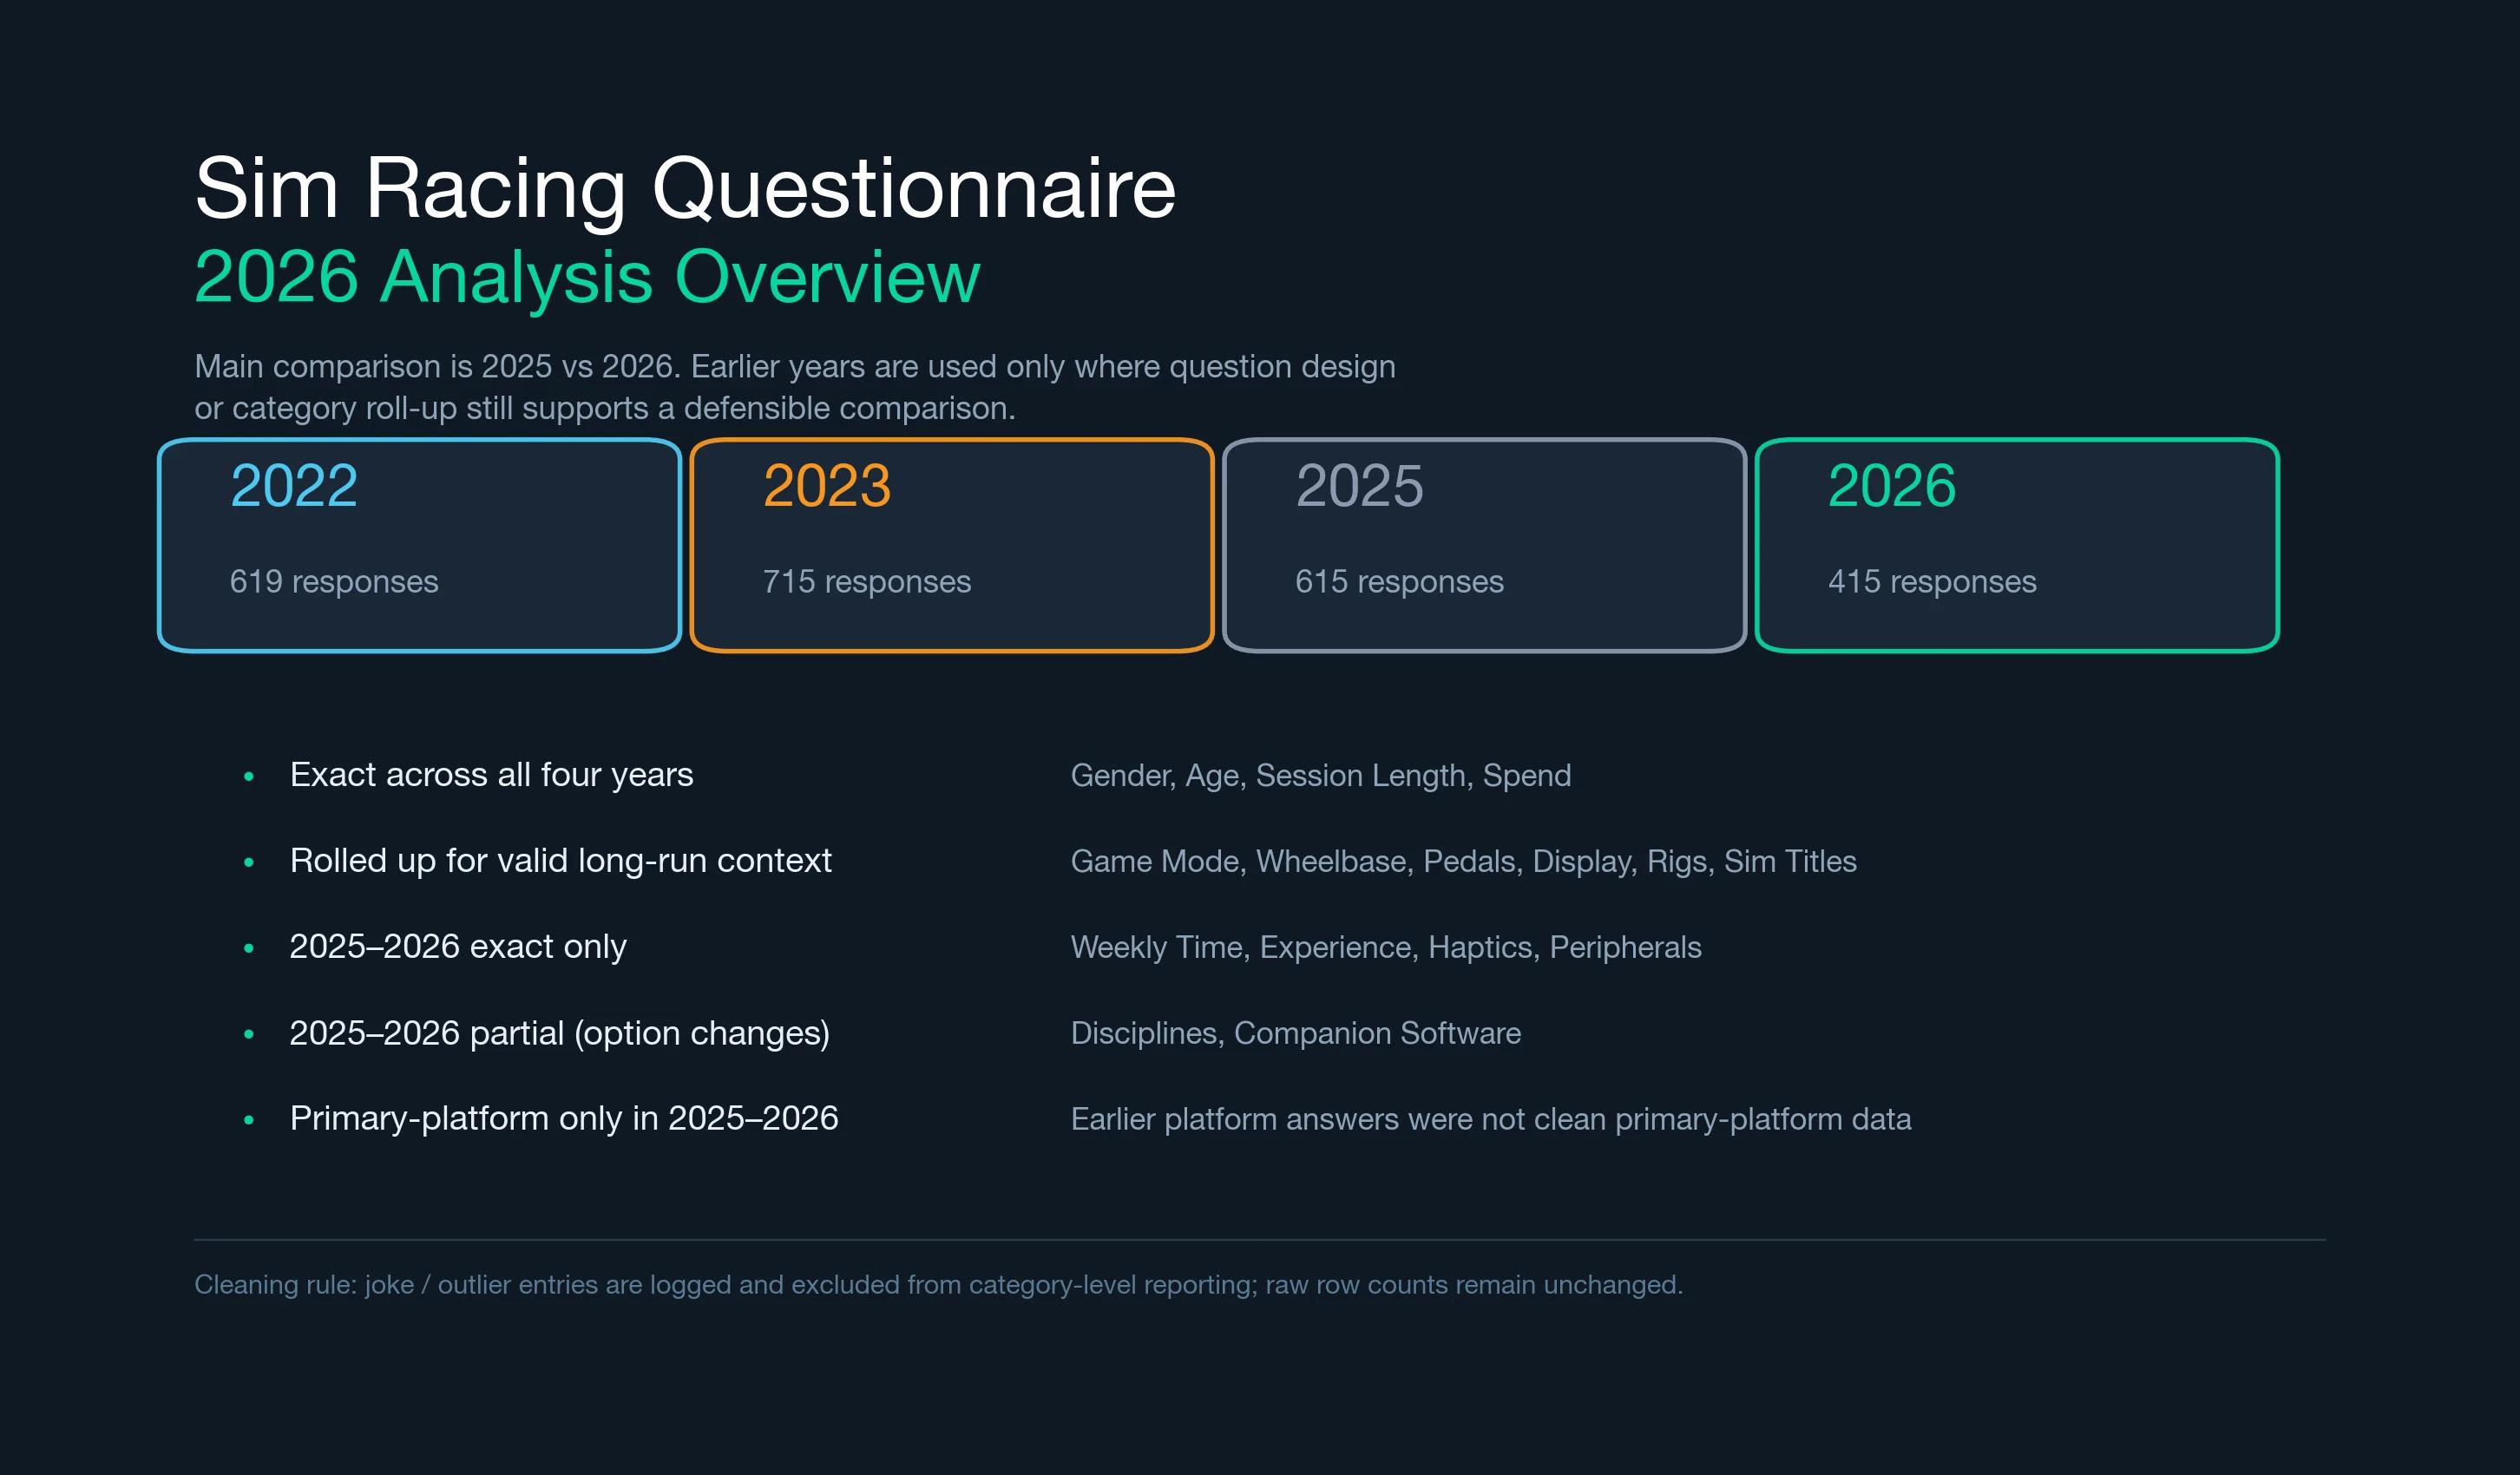
2,364 responses across 2022, 2023, 2025, and 2026, with openly documented trends and corrections.
In May 2022 I put together a sim racing hardware questionnaire for a university project, posted it to r/simracing, and stopped thinking about it. When I opened the sheet again there were 619 responses in it. People had not just filled in the form, they were asking in the comments when the results were coming and how their setup compared to everyone else's. Nobody publishes this data. Hardware manufacturers know their own sales and nothing else, and the community had no way to see itself.
So I ran it again in 2023, missed 2024 entirely because I ran out of time that spring, and picked it back up in 2025 and 2026. Four editions, 2,364 responses, all of it public: the raw sheets, the questions, the analysis and the write-ups. It is not market research and I do not pretend it is. It is a self-selected snapshot of the people who read a particular subreddit on a particular week, which is a real limitation and also the only reason it exists at all.
The questionnaire is easy. Making four editions comparable is not, and most of the work sits here:
People type what they own, not what the option list expects. A single wheelbase arrives as 'Simucube 2 Pro', 'sc2 pro', 'simu cube' and 'simucub'. I standardize with a dictionary of regex rules per brand family rather than fuzzy matching alone, because fuzzy matching quietly merges things it should not: Simagic and Simucube are a few characters apart and are not the same company. Every mapping rule sits in the analysis script, so a wrong roll-up can be found and argued with.
Later editions added options that earlier ones never offered. 'Ultrawide monitor' was not its own choice in 2023. 'Aluminium profile rig' was not listed before 2025. That means some of the sharpest looking growth in this dataset is partly a question-design artefact, and I mark those cases in the charts instead of letting the line speak for itself. Where the wording moved too far, I compare 2025 to 2026 only and say so.
Spend, age and rig type are one answer per person, so they sum to about 100 percent. Wheelbase brands, display setups and game titles are multi-select, so they sum to whatever they sum to. Treating those two kinds of question the same way is the fastest route to a chart that is confidently wrong, so the charts here label which is which, and every percentage uses valid responses for that question rather than the raw response count.
Three steps, repeated each year, deliberately boring:
The form goes up on r/simracing, stays open for two to three weeks, and gets one reminder post. I keep question wording identical to the previous edition wherever I can, because every improvement to a question costs me a trend line.
A Python script loads each edition's CSV, drops obvious joke rows from the category summaries while leaving the raw response count untouched, standardizes brand and category spellings, and writes out one table per question. Joke answers are excluded from category reporting, not from the headline counts, which is why some n values sit slightly below the response total.
The results go back to the subreddit as a plain post with the caveats at the top, and the raw sheet link goes with them. NotebookLM is useful for reading through hundreds of open-text comments quickly, but nothing it produces becomes a number in the report.
Moza led the 2026 wheelbase sample at 24.1%, ahead of Fanatec at 21.7%, Logitech at 17.9% and Simagic at 17.2%. Setups worth $2,000 or more reached 59.5%, up from 29.4% in 2022. Le Mans Ultimate went from 28.1% to 44.7% and became the most played title in the sample, while Assetto Corsa Competizione fell 21.8 points to 23.9%. Primarily multiplayer use rebounded from 56.4% to 70.4%.
"After the 2025 edition I wrote that sim racing had an aging problem: estimated average age had jumped to 37.9 and the under-25 brackets had collapsed. The 2026 edition put average age back at 35.1 and the 25-34 bracket back at 37.1%. The sample is still older than it was in 2022, but the cliff I described was mostly the shape of one year's respondents. That correction is the most useful thing four editions have produced."
Every chart below is interactive and reads from the same cleaned tables the Reddit posts use. The caveats come first because they change how you should read the rest.
Four things, and they apply to every chart on this page.
This is a self-selected sample. Nobody was randomly chosen. These are people who read r/simracing during the two or three weeks the form was open and felt like answering. That skews toward the engaged end of the hobby, and probably toward people with hardware they are pleased about. It is a snapshot of a community, not a measurement of a market.
There is no 2024 edition. I ran out of time that spring and skipped it. The trend charts show a labelled gap at 2024 rather than drawing a straight line through a year that does not exist.
Percentages use valid responses for that question, not the raw response count. Someone who skipped the spend question is out of the spend denominator. That is why the n values under each chart usually sit a little below the edition totals, and why obvious joke answers are dropped from category summaries but not from the headline response counts.
Multi-select questions do not sum to 100. Wheelbase brands, display setups and game titles all allow several answers, so a share means "percent of respondents who picked this", and a year can easily add up to 160. Spend, age and rig type are one answer each and do sum to about 100.
The cleanest comparison in the whole dataset is 2025 to 2026, because the wording barely changed. Anything reaching back to 2022 is doing more work and deserves more suspicion.
2022: 619 · 2023: 715 · 2025: 615 · 2026: 415
Bracket midpoints, n = 413. It was 29.2 in 2022.
2.729.4% in 2022. The share has risen at every edition.
+30.1 pts0.5% in 2022. Moza leads the 2026 sample.
+23.7 ptsThe 2026 edition is the smallest of the four at 415 responses. I posted it once and reminded once, the same as always, and it landed in a quieter week. Smaller n means wider error on every number below, particularly on the small categories, which is why I am not going to make anything of a two point move.
If you only look at one chart, look at this one. Direct drive went from an expensive enthusiast choice to the default, and the brands that owned the entry level in 2022 are not the brands that own it now.
The long arc is more dramatic than any single year. Logitech fell from 38.5% to 17.9% across the four editions. Thrustmaster fell from 26.6% to 5.8%. Moza rose from 0.5% to 24.1% and Simagic from 2.3% to 17.2%. Fanatec is the interesting one: it led in 2023 at 32.2% and has drifted down to 21.7% without ever falling off, which reads less like collapse and more like a crowded market.
One number in there is doing quiet work. "Controller or no wheel" was 26.1% in 2022 and is 4.6% in 2026. I do not think a quarter of sim racers threw away their gamepads. I think the survey's audience shifted toward people who own wheels, which is exactly the kind of self-selection drift a community survey cannot correct for.
This is the most consistent trend in the dataset. It has gone the same direction at every edition, with no year that even paused.
Rolled up, the three thresholds move together and none of them turned around:
I want to be careful about what this means. It does not mean sim racing got twice as expensive. It probably means some mix of three things: hardware genuinely moved upmarket, existing respondents kept spending over four years, and the survey drifted toward the people most invested in the hobby. The data cannot separate those, and anyone telling you it can is selling something.
After the 2025 edition I wrote a paragraph about an aging problem. Estimated average age had gone from 29.2 in 2022 to 37.9 in 2025, the under-25 brackets had collapsed, and the story wrote itself: young racers were getting priced out. It got a lot of agreement in the comments, which should have made me more suspicious rather than less.
Then 2026 came back at 35.1 and the bracket detail undid most of the story:
So the honest read is narrower than what I published in 2025. The sample is still much older than it was in 2022: 18-24 is 11.6% now against 26.6% then, and 14-17 is 3.9% against 11.4%. That gap is real and it has not closed. But 2025 was not the start of a slide, it was one unusually old wave, and I described it as a trajectory when I only had a point.
The single cleanest 2025 to 2026 result, and one where the wording did not move.
Underneath, every multiplayer category grew and single-player gave back everything it gained:
| 2025 | 2026 | |
|---|---|---|
| Ranked / competitive multiplayer | 24.4% | 32.3% |
| Casual lobbies / daily races | 21.1% | 25.5% |
| League racing | 10.9% | 12.5% |
| Single-player | 40.5% | 28.0% |
Ranked racing was the biggest single gain. Session length barely moved over the same period, so this is a change in what people do in the rig, not how long they sit in it.
1-2 hour sessions stayed the default at 62.1% in 2025 and 64.3% in 2026.
I do not have an explanation for this and I am not going to invent one. A fourteen point swing back in a single year mostly tells you how much a self-selected sample can move on its own.
The year-over-year movement is sharper than the ranking:
| 2025 | 2026 | |
|---|---|---|
| Le Mans Ultimate | 28.1% | 44.7% |
| iRacing | 31.2% | 34.5% |
| Automobilista 2 | 30.4% | 29.2% |
| Assetto Corsa | 42.5% | 36.5% |
| Rally (WRC / DR2 / RBR) | 28.9% | 17.2% |
| Assetto Corsa Competizione | 45.8% | 23.9% |
Le Mans Ultimate gained 16.6 points and became the most played title in the sample. Assetto Corsa Competizione lost 21.8, the sharpest fall anywhere in four editions of this survey.
Multi-select, so a respondent appears in several rows. Rally combines EA Sports WRC, DiRT Rally 2.0 and Richard Burns Rally.
Disciplines barely moved by comparison. GT racing sat at 75.0% and 75.2%, open-wheel stayed around 40%, endurance ticked up from 28.0% to 29.9%. But 2026 also added Prototype/Hypercar, spec series and road-car categories that did not exist before, which mechanically pulls share away from the older options. That is the answer-set problem from section two, and it is why the discipline numbers are in a paragraph rather than a chart.
The one cross-tab worth keeping. Nothing here is surprising, which is the point: it is a sanity check that the sample behaves the way you would expect.
Each row sums to about 100%
Total spent on the setup, 2026
Experience
| Experience | <$500 | $0.5–1k | $1–2k | $2–5k | $5–10k | $10–30k | $30k+ | n/a |
|---|---|---|---|---|---|---|---|---|
| Beginner | 19% | 30% | 19% | 14% | 8% | 5% | 0% | 5% |
| Intermediate | 7% | 17% | 20% | 32% | 17% | 7% | 0% | 0% |
| Advanced | 6% | 7% | 9% | 40% | 21% | 12% | 1% | 3% |
| Esports / pro | 0% | 25% | 0% | 50% | 25% | 0% | 0% | 0% |
Beginners cluster under $1,000 (48.6% of them). Advanced respondents concentrate in the $2,000 to $10,000 range (61.8%) and carry a much larger $10,000-plus tail. The esports row is a handful of people and should be read as a curiosity, not a finding.
Row-normalized from the 2026 responses. Self-reported experience level, so the boundaries are the respondent's own.
This does not mean expensive hardware makes anyone faster. It means the people who have been at this longest have bought more equipment, which is what you would guess before opening the data. I include it because a cross-tab that confirms the obvious is a useful signal that the cleaning did not break something.
VR is the quieter story. It peaked at 31.7% in 2025 and came back to 28.2% in 2026, and it has never been the minority curiosity people outside the hobby assume. Triple screens have sat between 12% and 15% for four straight editions, which surprised me: the setup everyone pictures when they picture sim racing is not the setup most people own.
What does survive all of that: the wheelbase mix changed enormously and consistently, spending moved upmarket at every single edition, and the 2025 aging story was one wave, not a direction.
The 2025 aging story was internally consistent, matched what people were saying in the comments, and did not survive contact with 2026. A single wave of a self-selected survey tells you what that wave looked like. Only the repeat tells you what is moving, which means the boring discipline of running it again on the same questions is worth more than any individual finding.
Adding 'ultrawide' and 'aluminium profile rig' as explicit options made those editions better and permanently damaged two trend lines. Both categories look like explosive growth partly because respondents finally had a box to tick. If a question has to change, the honest move is to say so in the chart rather than in a footnote nobody reads.
Every edition ships with a public link to the underlying responses. It costs nothing, it has caught me in at least one bad roll-up, and it is the only thing separating a community survey from someone posting numbers they made up. If I am not willing to publish the sheet, I should not be publishing the chart.
Four editions, 2,364 responses, and a set of findings that mostly hold up: the hardware mix genuinely changed, with Moza and Simagic moving from the fringe to the centre while Logitech and Thrustmaster lost more than half their share. The money genuinely moved upmarket at every single edition. The demographic story I told in 2025 did not hold up, and saying so plainly is worth more than defending it.
The point of this project is not that a subreddit survey can replace market research. It cannot. The point is that a community with no public data at all is better served by an imperfect, openly caveated, fully published census than by nothing, and that running the same imperfect thing four times is what turns it into something you can reason with.
 Alp Yalay